 |
|
Spotlight Our widgets for functional genomics use Orange, a data mining
and machine learning suite. Orange can be accessed through scripting in
Python,
or by visual programming in Orange Canvas. |
| FRI > Biolab > Supplements > Microarray Data Mining with Visual Programming > S. cerevisiae Example > Genome Map widget | |
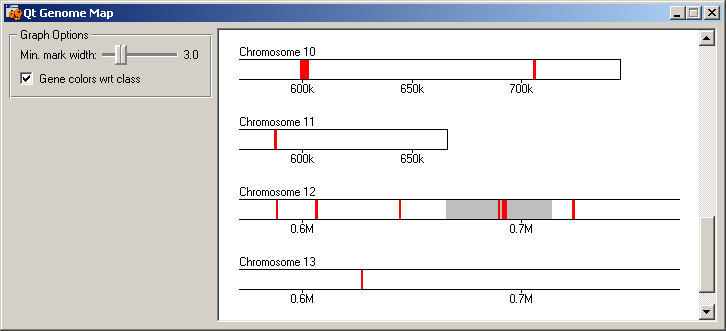
Genome Map widgetCho et al. (1998) reported that more than 25% of the genes displaying periodic transcript levels were positioned directly adjacent to another gene induced in the same cell cycle phase. To illustrate one such example, the "Genome Map" widget is used. Two adjacent genes on the chromosome 12, CDC46 (YLR274W) and PIG1 (YLR273C) are both present in the selected group of M/G1 genes. Their transcription start sites are located on the opposite strands less than 500 base pairs apart, therefore the genes share a common DNA region for the upstream regulatory sequence. "Expression Profiles" widget
is used to show that the two genes are coexpressed.
|
|

