 |
|
Spotlight Our widgets for functional genomics use Orange, a data mining
and machine learning suite. Orange can be accessed through scripting in
Python,
or by visual programming in Orange Canvas. |
| FRI > Biolab > Supplements > Microarray Data Mining with Visual Programming > D. discoideum Example > K-Means Clustering widget | |
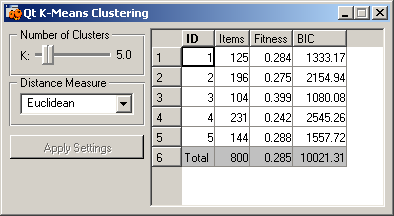
K-Means Clustering widgetFirst step in our analysis is to cluster genes based on their expression profiles. We have used the k-means clustering algorithm, with k set to 5 and the Euclidean measure for distance. Input of this widget are data tokens coming from the "File" widget. The output of the "K-Means Clustering" are new data tokens where genes are classified into k=5 clusters. Statistics giving the number of genes (Items) in each cluster and two quantitative measures of cluster quality are displayed.
|
|

