 |
|
Spotlight Our widgets for functional genomics use Orange, a data mining
and machine learning suite. Orange can be accessed through scripting in
Python,
or by visual programming in Orange Canvas. |
| FRI > Biolab > Supplements > Microarray Data Mining with Visual Programming > D. discoideum Example > Expression Profiles widget | |
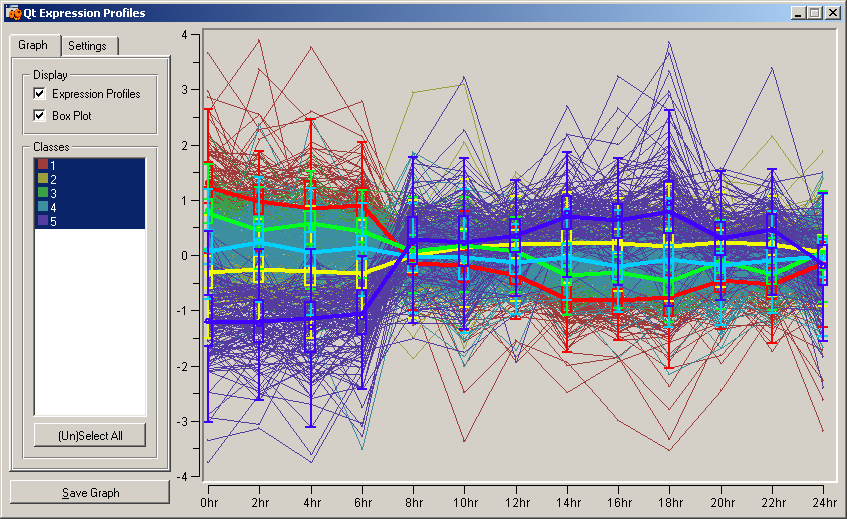
Expression Profiles widgetThis widget implements a standard method for gene expression visualization. Genes in the five clusters coming from the "K-Means Clustering" widget are colored according to the cluster they belong. Expression profile of individual genes and the average cluster profiles are drawn. We can show or hide individual clusters by selecting items in the "Classes" list box.
|
|

