| FRI > Biolab > Supplements | ||||||||||
|
VizRank step-by-step guideThis is a step-by-step guide that shows how to use Orange to find interesting visualizations of a data set. Starting Orange
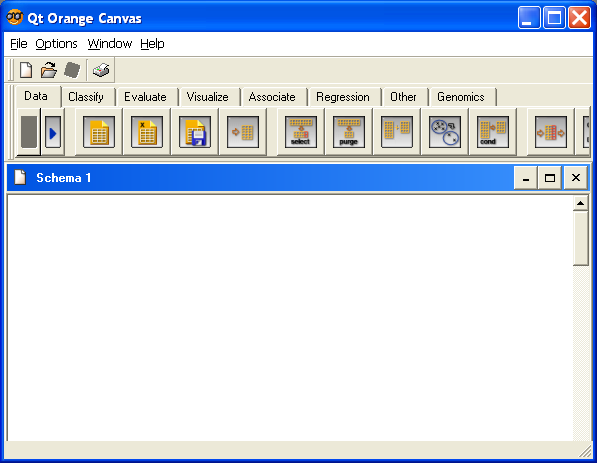
Orange CanvasOrange Canvas provides a visual programming data environment, where the user builds the data analysis schema by combining different analysis components called widgets. In Orange Canvas the widgets are represented with graphical icons, and can be found in different tabs (Data, Classify, ...) according to their function. To use a widget, click on its icon. The widget's instance will then be placed on the canvas. Below is a screenshot of Orange canvas showing the widgets in the Data tab.
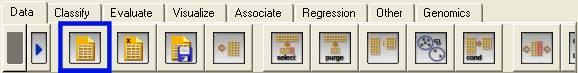
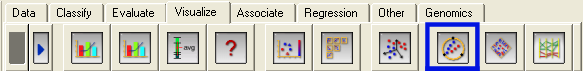
To find interesting data visualizations from cancer microarray data sets we will only need two widgets: the File widget from the Data tab and the Radviz widget from the Visualize tab. Here are the screenshots of the two widget tabs:
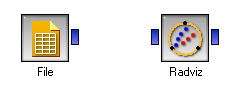
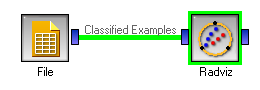
By clicking on both of the widgets we get the following schema on the canvas:
Notice that beside the icons representing the widgets, each of the icons also has small blue boxes on the left and/or right side. These small boxes represent the channels for widget's inputs and outputs, respectively. We will use the File widget to load the data and send it to the RadViz widget. To establish this communication between our two widgets, click on the File widget's output box (the small blue box on the right side of the File widget) and drag an emerging line to the Radviz widget's input box (the small blue box on the left side of the Radviz widget). After doing this the schema should look like this:
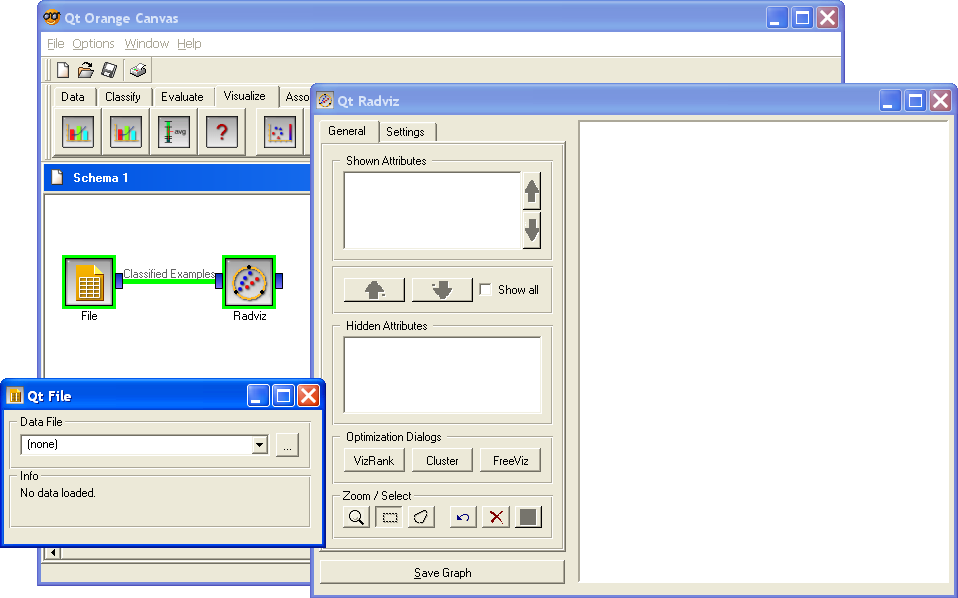
The graphical interface of each widget can be accessed by double-clicking the widget's icon on the canvas. By double-clicking the File and the Radviz widgets we open the following dialogs:
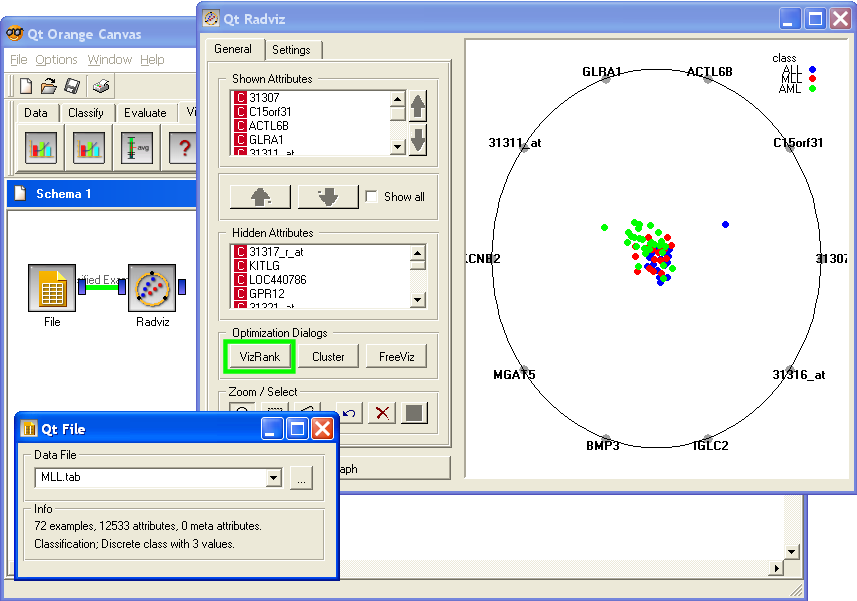
Notice that there is no graph in the Radviz widget. This is because no data has been loaded in the File widget. To do this, press the "..." button in the File widget. This opens a dialog for the input file selection. If we, for example, select the MLL.tab file (you need to have this data on your local disk, download it from here or download any of the other cancer microarray data sets from data sets page). The File widget loads the data set and sends it to the Radviz widget. After receiving the data, the Radviz widget will show a visualization using the first few attributes:
The VizRank dialogIn order to find data visualizations with good class separation for our data we have to open the VizRank dialog. Do this by pressing the "VizRank" button (indicated by the green rectangle in the upper figure).
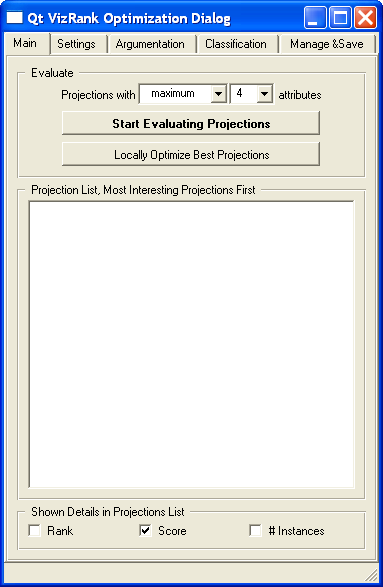
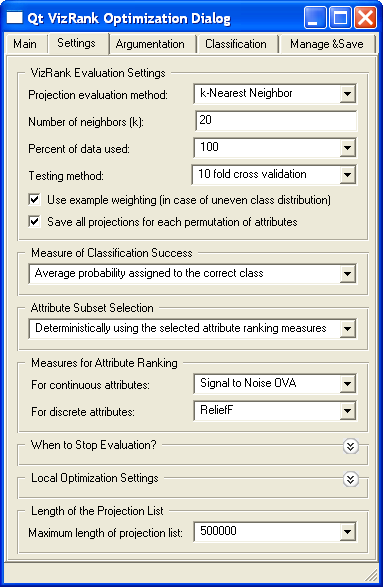
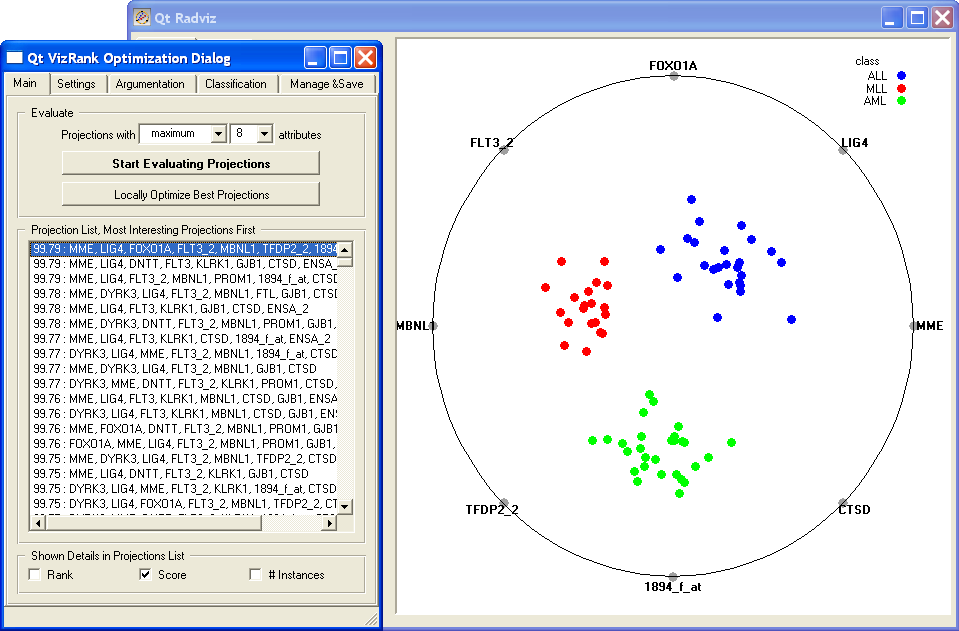
The Main tabThe Main tab includes controls for starting the projection evaluation and for browsing through the scores of the evaluated projections. After we decide how many features the evaluated projections should contain, we can start the projection search by pressing the "Start Evaluating Projections" button. Each evaluated projection will be automatically added to the list of projections. The Settings tabIn the Settings tab we can change several parameters that control the projection evaluation. VizRank Evaluation Settings. Here we can change the parameters of the k-NN algorithm used by VizRank when evaluating the projections. Measure of Classification Success. Here we decide which method we would like to use to score the projections. We can choose among classification accuracy, Brier score and average probability of correct classification. Attribute Subset Selection. This parameter defines the selection method for the subset of attributes (genes) that are to be used in an evaluated projection. In all our experiments in the paper we used the option "Use gamma distribution and test all possible placements". Measures for Attribute Ranking. Here we can decide which method for the initial ranking of features we would like to use. In the paper we used "Signal to noise ratio". Finding interesting visualizationsTo start evaluating different data visualizations we have to press the "Start Evaluating Projections" button in VizRank's Main tab. Evaluated projections showing the score and the list of included features will be added to the sorted list of projections. To see a specific projection simply click it on the list. In the figure below there is the list of the top projections of the MLL data set with the best projection visualized in the Radviz widget.
|
||||||||||
 |
||||||||||