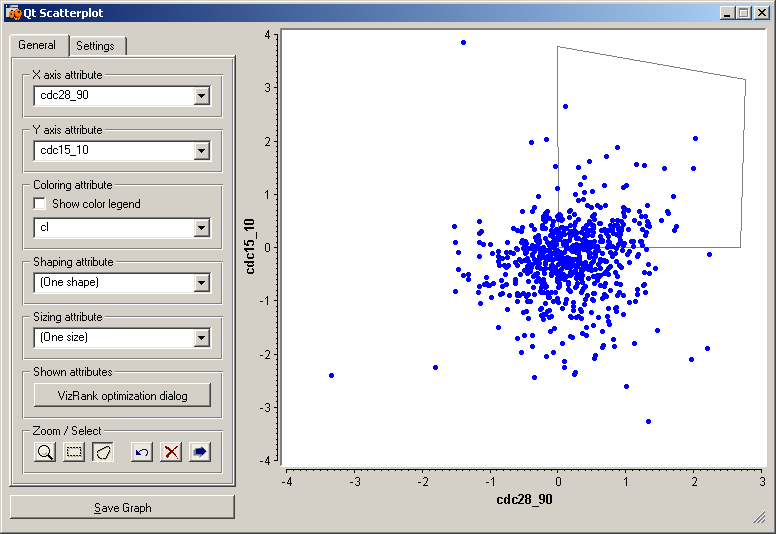
Two experimental points, representing the M/G1 cell cycle phase, from two different methods for yeast synchronization were used in two subsequent "Scatter Plot" widgets. As seen in the "Expression Profiles (2)" and "Heat Map" widgets, genes with an increase in expression in M/G1 phase were obtained with this procedure.

.png)