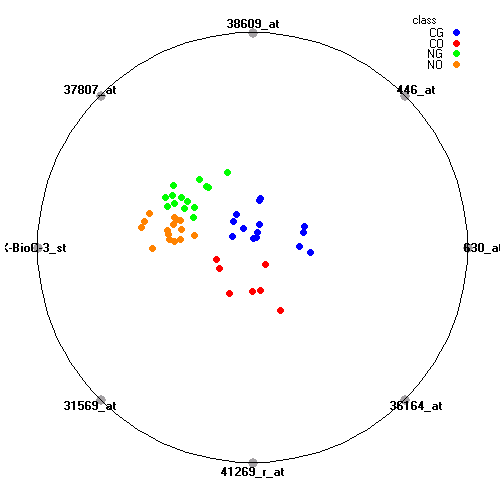
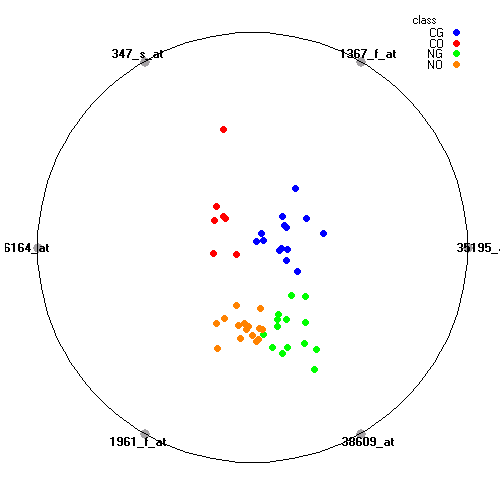
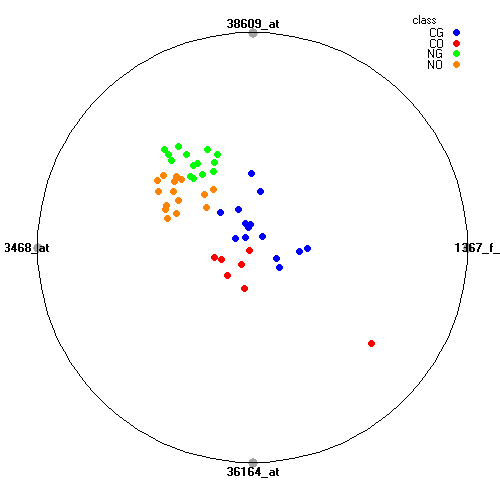
Malignant gliomas and oligodendrogliomas can be histologically divided into 2 subgroups, the classic and nonclassic type. Tumors in the nonclassic subgroup are diagnostically especially challenging, generating considerable interobserver variability and limited diagnostic reproducibility when the classification is done by histological features. The model shown distinguishes between 4 diagnostic classes (classic and nonclassic gliomas and oligodendrogliomas) on the basis of DNA gene expression signatures.
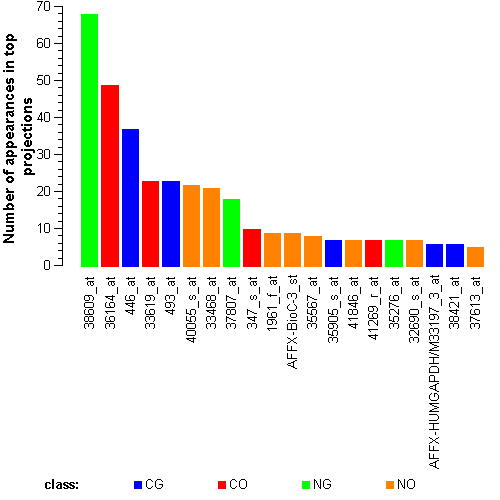
Following are the three best-ranked visualization with eight, six and four attributes in respect to the visualization score, that is, visualizations where examples from different diagnostic classes are best separated: