| FRI > Biolab > Supplements | |||||||||
Data set name: braintumorOriginal data set (Pomeroy et al.) Data set for Orange
Platform: Affymetrix HuGeneFL array
Number of samples: 40
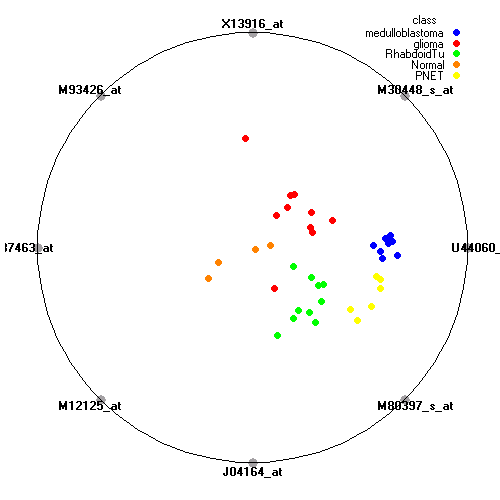
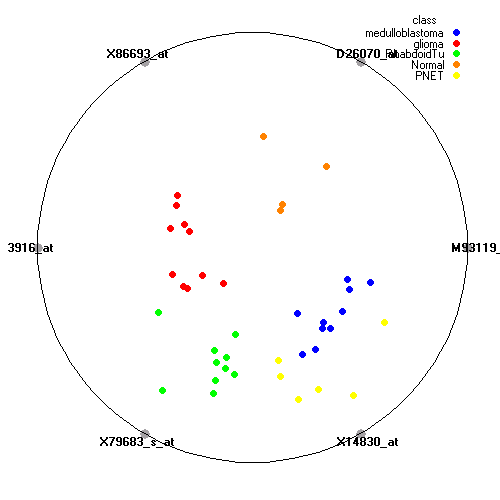
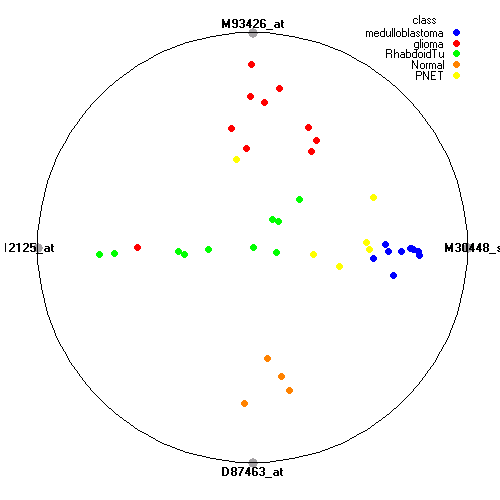
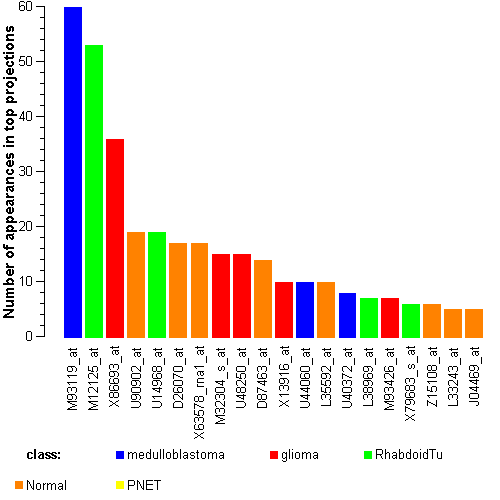
Attribute rankingFollowing is the histogram of genes showing how often are they present in one of the top 100 radviz visualizations with 8 attributes.
|
|||||||||


