The childhood ALL data set (GSE412) includes gene expression information on 110 childhood acute lymphoblastic leukemia samples. For this data set we induced models for two different classification problems. With the first model we try to distinguish between childhood acute lymphoblastic leukemia cells based on changes in gene expression before and after treatment, regardless of the type of treatment used.
Platform: Affymetrix GeneChip Human Genome U95 Version [1 or 2] Set HG-U95A
Diagnostic classes:
- before therapy (before Th): 50 examples (45.5%)
- after therapy (after Th): 60 examples (54.5%)
Number of genes: 8280 Number of samples: 110 Note: From the originally measured 12625 probe sets we removed genes that were not present (P) in at least one sample
Predictive accuracy with 10-fold cross validation (classifying using the best projection with eight attributes):
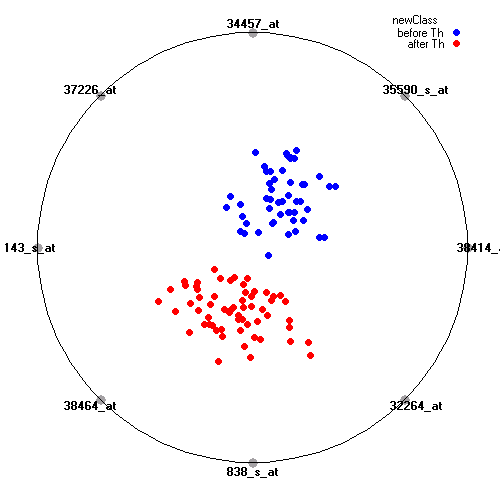
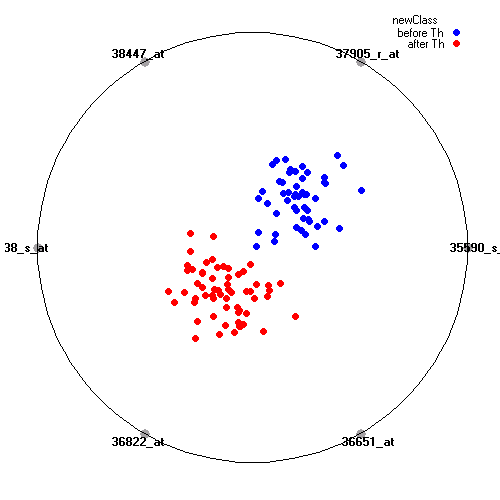
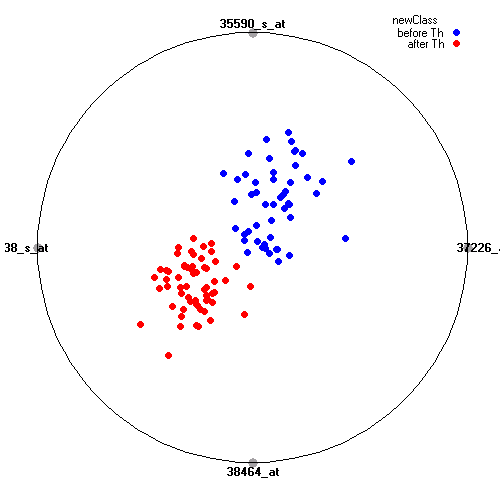
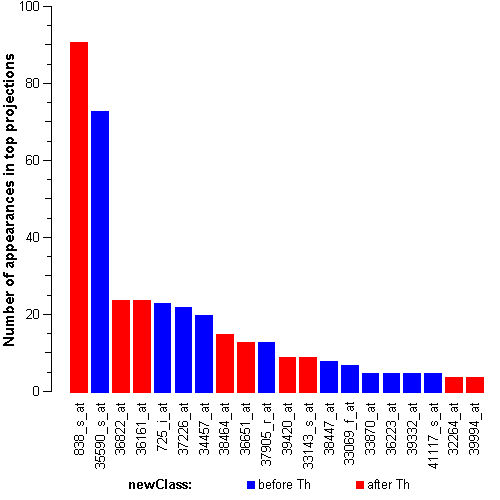
Following are the three best-ranked visualization with eight, six and four attributes in respect to the visualization score, that is, visualizations where examples from different diagnostic classes are best separated:
Score: 98.95% Genes: 38414_at: CDC20 cell division cycle 20 homolog (S. cerevisiae), CDC20 35590_s_at: gastric inhibitory polypeptide receptor, GIPR 34457_at: solute carrier family 30 (zinc transporter), member 3, SLC30A3 37226_at: BCL2/adenovirus E1B 19kDa interacting protein 1, BNIP1 33143_s_at: solute carrier family 16 (monocarboxylic acid transporters), member 3, SLC16A3 38464_at: glucosidase I, GCS1 838_s_at: ubiquitin-conjugating enzyme E2I (UBC9 homolog, yeast), UBE2I 32264_at: granzyme M (lymphocyte met-ase 1), GZMM