|
Spotlight Try VizRank online - You can now experiment with VizRank online. Find interesting data projections of your own data sets. |
| FRI > Biolab > Supplements | ||||
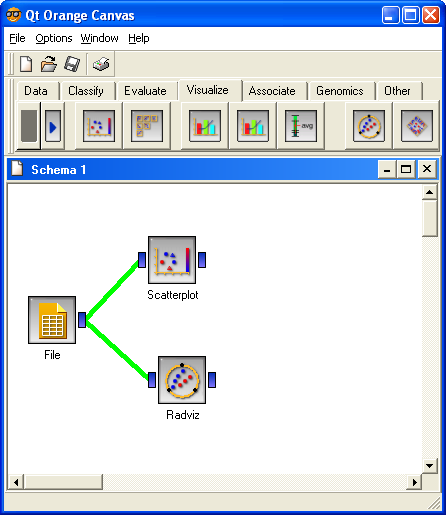
How to Use VizRank in Orange CanvasHere we provide a very short tutorial to Orange Canvas and present a sample schema that can be used to find interesting projections using scatterplot and radviz method. For details on Orange Canvas and widgets, please read the Orange Widgets white paper. VizRank is a tool that is implemented inside Orange, which can be downloaded here. To use VizRank you have to start an application called Orange Canvas - the shortcut to it should be on your desktop and in your Start menu. Orange Canvas is our application that can be used to interactively explore, visualize and model the data using several components called widgets. The figure below shows a screenshot of the application and a sample schema that can be used to find interesting data projections using scatterplot and radviz visualization methods.
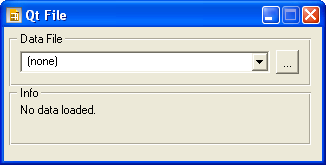
You can create such schema yourself or you can downloaded it here and load it in Orange Canvas by clicking File/Open menu item. Loading a Data SetBefore the scatterplot and radviz can be used, the data set must be loaded. To do this, we must first double-click on the File widget icon in the canvas to show its graphical interface. If this is the first time you use Orange, the interface should look like the screenshot below.
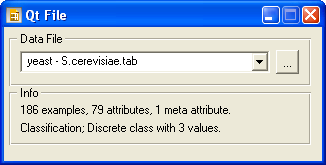
The data set can now be loaded by clicking on a "..." button in the top right part of the dialog, which will open the Open File dialog where you can select a data set you wish to visualize. To see the list of compatible data set formats please see the Orange Reference. Once the data set is loaded, File widget shows the data set file name in the combo box and presents a short information about the data (see the screenshot below). Data is also immediately sent to the scatterplot and radviz widgets and projections can be seen by double-clicking on scatterplot or radviz icon in the canvas. To learn how to find interesting projections in this data set, please see VizRank's graphical interface section of this supplement.
|
||||
 |
||||