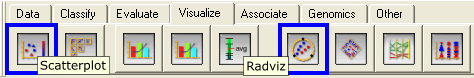
VizRank is implemented inside Orange and it can be used with any visualization method that projects high-dimensional data to points in two dimensional space. In Orange, we implemented two such visualization methods - scatterplot and radviz. You can use them by starting Orange Canvas (if you installed Orange, the "Orange Canvas" icon should be on your desktop), selecting Visualize tab and clicking on one of the buttons that are on the bottom figure encircled. For introductory information on how to use Orange and Orange Canvas please see Orange and Orange Widgets white paper. More details can also be found on Orange web site.
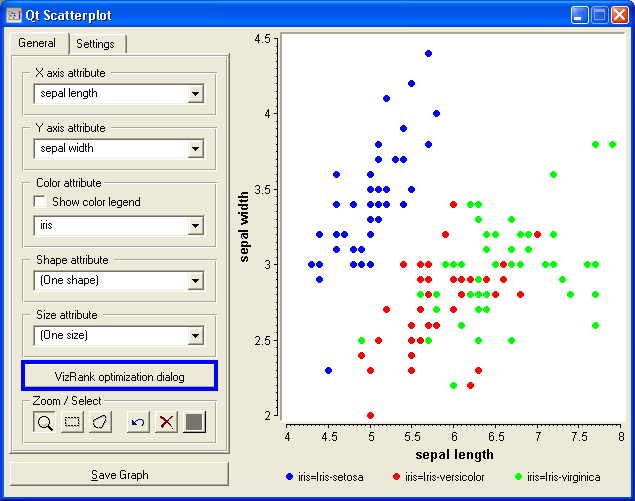
Each of this visualization methods has a button on the lower left edge of the dialog, named "VizRank optimization dialog" (see the scatterplot example below). Clicking this button will open the VizRank dialog.
VizRank dialog consists of three tabs:
Following is a detailed description of each of these tabs.
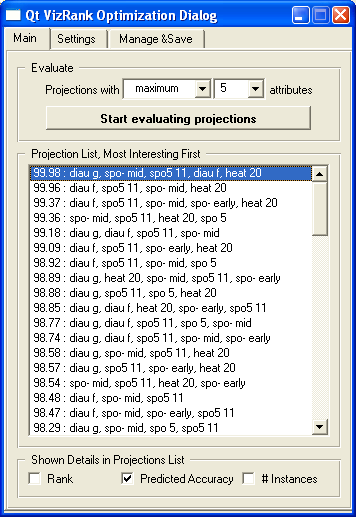 |
Rank, Predicted Accuracy, # Instances: check boxes that determine the details that are presented for each projection in the Projection List . Rank represents the index of the projection in the Projection List, Predicted Accuracy is the estimate of projection usefulness as determined by VizRank and #Instances is the number of data instances in the projection (due to missing values, different attribute subsets can have different number of valid instances). |
|---|
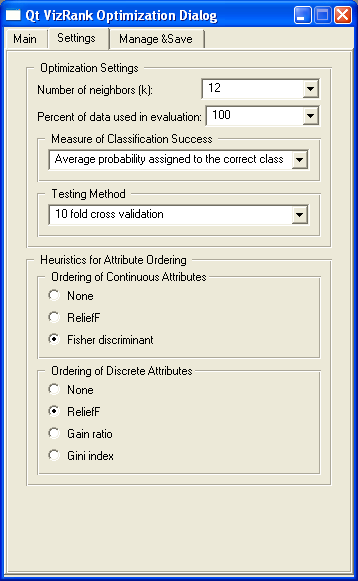 |
Number of neighbors (k): number of neighbors used in
k-nearest neighbor (k-NN) algorithm. Percent of data used in evaluation: Since the projection assessment can take a long time when evaluating large data sets (more than a few thousand examples), we can tell VizRank to use only a subset of the data to make the assessment faster. Measure of classification success: a measure that evaluates prediction success of k-NN classifier on the given projection. Possible values are:
For details on this measures see "Evaluating Usefulness of a Projection" section in VizRank method details Testing Method: an evaluation schema for testing prerformance of a classifier. Possible values are:
Heuristics for Attribute Ordering: this is a heuristic, that enables VizRank to first evaluate attribute groups that are most likely to be interesting. For details see "Heuristic" section in VizRank method details. |
|---|
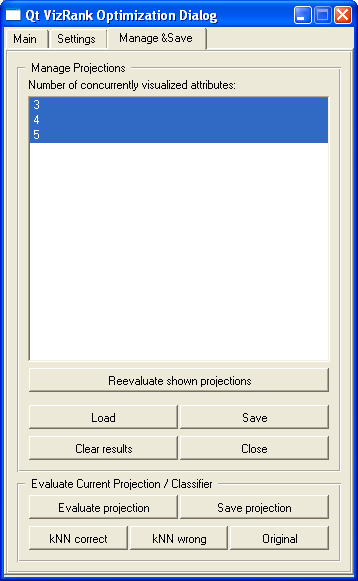 |
Number of concurrently visualized attributes: Items in this list box represent the lengths of attribute groups of projections in Projection List. For scatterplot method the only value in the list box will be "2" (since scatterplot can concurrently visualize only 2 attributes), while for radviz method it can contain any value between 3 and the number of attributes in the data set. Deselecting any of this items in the list box will remove projections with that number of attributes from the Projection List. Reevaluate shown projections: Reevaluate projections from the Projection List with VizRank's current settings. Load: Load the list of assessed projections from a file. Save: Save the current list of assessed projections from Projection List to a file. Evaluate projection: Assess usefulness of current data projection with VizRank's current settings. kNN correct: show k-NN classifier performance on the current projection. Show correctly classified examples as dark points and wrongly classified as white points. kNN wrong: similar to kNN correct, just that the colors are inverse. Original: show projection where points are colored using class attribute. |