Schema
The following is a snapshot of the schema designed and used for the analysis of Dictyostelium development data.
Clicking on a widget icon in the schema displays a snapshot of the widget during analysis.
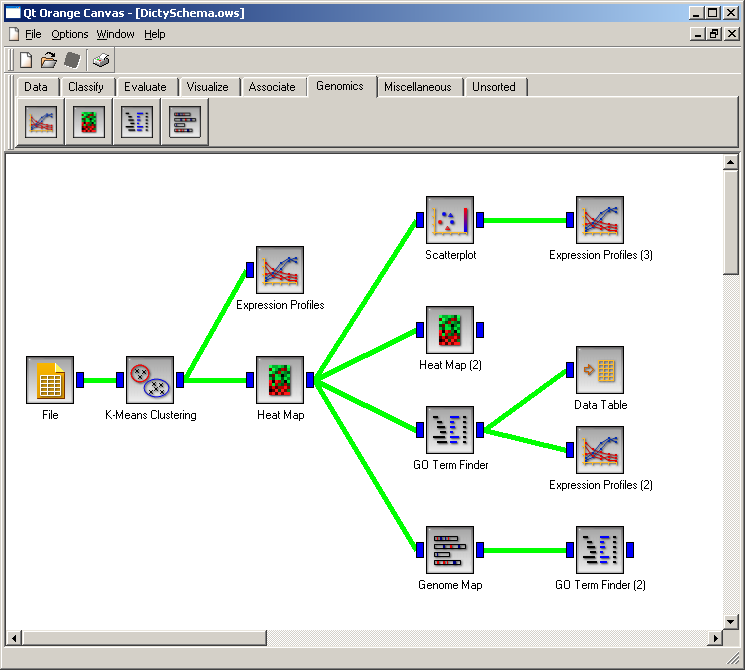
The Orange Canvas interface that allows the design of schemas is also shown. The four widgets described in the paper are
registered in the "Genomics"
tab: "Expression Profiles", "Heat Map", "GO Term Finder"
and "Genome Map." The user selects an icon from the tab, places
it on canvas and connects it with other widgets already on canvas.