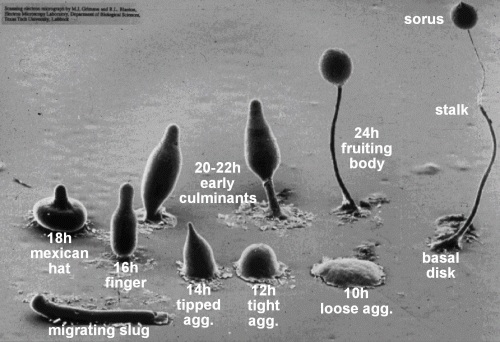
Development of Dictyostelium (M. Grimson, R. Blanton, Texas Tech University)
We illustrate the use of our system through an example on Dictyostelium development microarray data from the study (Van Driessche et al., 2002). We also used gene mapping information (www.dictybase.org), manual annotations (Van Driessche et al., 2002) and GO annotations (Katoh et al., 2004).

Development of Dictyostelium (M. Grimson, R. Blanton, Texas Tech
University)
During the distinct aggregative transition in the development from a unicellular to a multicellular life style major changes in gene expression occur. About 40% of all the genes in the genome change their expression during development, mostly during that transition. Groups of genes have been identified that coincide with major developmental events, for a detailed description see (Van Driessche et al., 2002). Gene expression of 7385 genes was measured at 2-hours intervals over 24 hours, resulting in 13 time points. The study identified two groups of 2021 genes whose expression change coincides with the most dramatic morphological transitions in Dictyostelium development: the transition from unicellular development to multicellular development between 6 and 8 hours. (Van Driessche et al., 2002)
The average expression in the first group of genes is lower-than-average during growth and early development (0-6 hour) and higher-than-average in later times (8-24 hour). The average expression in the second group of genes is the opposite: higher-than-average during growth and development (0-6 hour) and lower-than-average later in development (8-24 hour). In this later group the study found some genes previously described to cysteine protease and vegetative ribosomal genes. (Van Driessche et al., 2002) We rediscover this in our analysis.
We have designed a widget-based schema, where we first cluster genes based on their expression. Then we take our explorative analysis further by incorporating other heterogeneous sources of data. For this we use widgets such as "GO Term Finder" and "Genome Map." Details of each step are given along with widget snapshots (click on widgets in the schema).
For illustrative purposes, we have selected a subset of 800 genes from Table 7 in the web supplement of (Van Driessche et al., 2002). Starting with 7385 genes considered in the paper, we have selected a subset of 4158 genes with no outlier or missing expression values. We wanted our subgroup of 800 genes to have all the representative expression profiles, so we have clustered the 4158 genes into 9 clusters and made a stratified selection of 800 genes.
To rerun the analysis one needs all of the following data files. They come with the instalation of Orange, so there is no need to install them separately:
Ashburner M., Ball C.A., Blake J.A., Botstein D., Butler H., Cherry J.M., Davis A.P., Dolinski K., Dwight S.S., Eppig J.T. and others. (2000) Gene ontology: tool for the unification of biology. The Gene Ontology Consortium. Nat Genet, 25, 25-9.
Katoh M., Shaw C., Xu Q., Van Driessche N., Morio T., Kuwayama H., Obara S., Urushihara H., Tanaka Y., Shaulsky G. (2004) An Orderly Retreat: Dedifferentiation is a Regulated Process. Under revision, Proc. Natl. Acad. Sci.
Van Driessche N., Shaw C., Katoh M., Morio T., Sucgang R., Ibarra M., Kuwayama H., Saito T., Urushihara H., Maeda M. and others. (2002) A transcriptional profile of multicellular development in Dictyostelium discoideum. Development, 129, 1543-52.